Objectives
- Enter and format data in an Excel spreadsheet in a form appropriate for graphing
- Create a scatter plot from spreadsheet data
- Insert a linear regression line (trendline) into the scatter plot
- Use the slope/intercept formula for the regression line to calculate a x value for a known y value
- Explore curve fitting to scatterplot data
- Create a connected point (line) graph
- Place a reference line in a graph
Part 1 - Beer's Law Scatter Plot and Linear Regression
Beer's Law states that there is a linear relationship between concentration of a colored compound in solution and the light absorption of the solution. This fact can be used to calculate the concentration of unknown solution, given their absorption readings. First, a series of solution of known concentration are tested for their absorption level. Next, a scatter plot is made of this empirical data and a linear regression line is fitted to the data. This regression line can be expressed as a formula and used to calculate the concentration of unknown solutions.

Beer's Law Part 2 - Titration Data Plottin
Creating a Scatter Plot of Titration Data

Titration graph with the legend In this next part of the tutorial, we will work with another set of data. In this case, it is of a strong acid-strong base titration. With this titration, a strong base (NaOH) of known concentration is added to a strong acid (also of known concentration, in this case). As the strong base is added to solution, its OH- ions bind with the free H+ions of the acid. An equivalence point is reached when there are no free OH- nor H+ ions in the solution. This equivalence point can be found with a color indicator in the solution or through a pH titration curve. This part of the tutorial will show you how to do the latter.

Titration graph with the absent of legend Tutorial task during the class- Finding the line of best fit
The table shows the temperature at the start of the race and the percentage of runners injured in eight running of the Boston Marathon.
Temperature (in °C)82215131221209Percentage injured p4.712.36.55.96.610.38.44.0
- Use Excel to plot a scatter graph and find an equation of the regression line for the data.
- Use regression equation to estimate the percentage of runners that would be injured if the marathon was run on a day when the temperature was 27°C.
- Use the regression equation to estimate the temperature at the start of the race for a race in which 10% of the runners were injured.
Answer:

Temperature - Quadratic regression
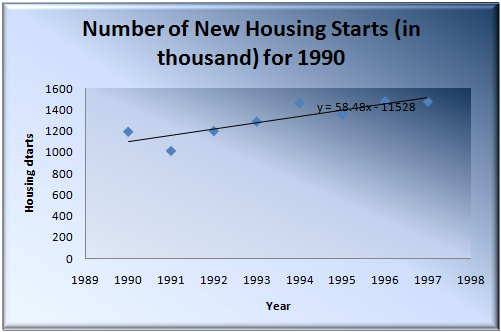
The following table shows the number of new housing starts (in thousand) for 1990 through 1997.
Year (x)19901991199219931994199519961997Housing starts (y)11931014120012881457135414771474
- Use Excel to plot a scatter graph and find an equation that gives the number of new housing starts in terms of the year.
- Predict the number of new housing starts in 2001.
Answer:

House
Wallahu'alam